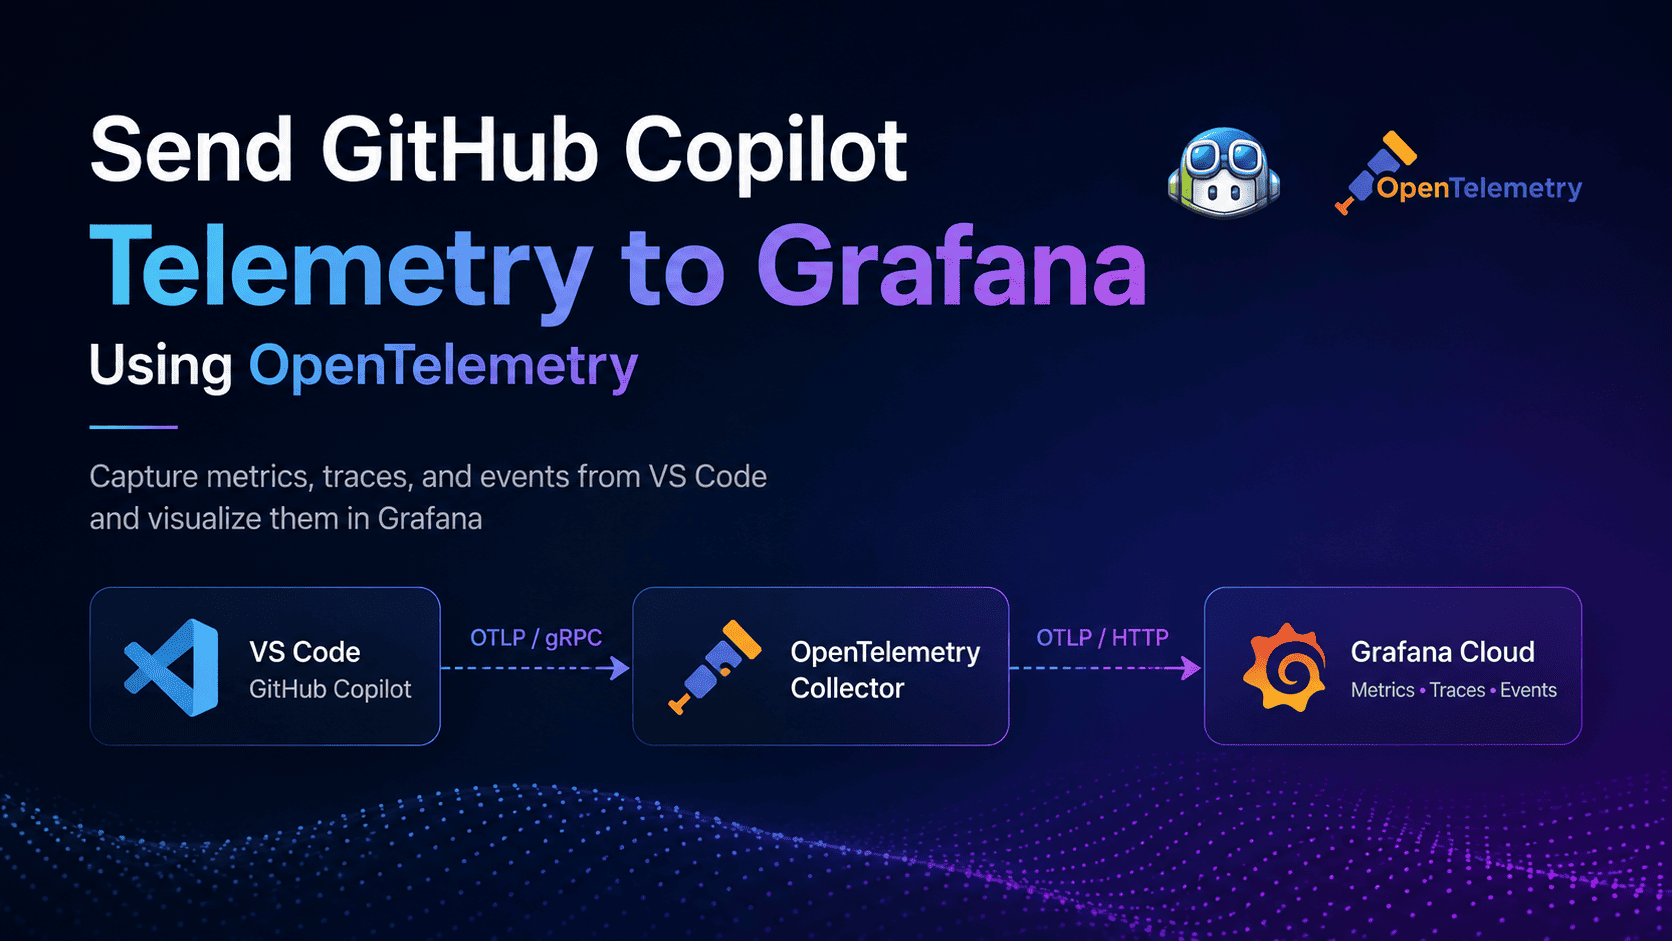
GitHub Copilot in VS Code can emit telemetry using OpenTelemetry (OTel). This telemetry includes traces, metrics, and events related to Copilot interactions, including information that can help analyze agent activity and token usage.
In this guide, we will configure VS Code to send Copilot telemetry to a local OpenTelemetry Collector, which will then forward it to Grafana Cloud using the OTLP protocol.
This setup is useful if you want to analyze Copilot usage patterns, understand token consumption, and build dashboards around your AI-assisted development activity.
Prerequisites
You will need:
- A Grafana Cloud account. The free tier is sufficient for getting started.
- VS Code with GitHub Copilot enabled.
- Docker installed and running.
Architecture
The overall flow is:
VS Code
   |
   | OTLP/gRPC
   v
OpenTelemetry Collector
   |
   | OTLP/HTTP
   v
Grafana Cloud
The OpenTelemetry Collector acts as an intermediate layer between VS Code and Grafana Cloud. It receives telemetry locally and forwards it to Grafana's OTLP endpoint.
Grafana Cloud supports OTLP ingestion for metrics, logs, and traces.
Step 1: Set Up Grafana Cloud and Get the OTLP Credentials
First, we need the Grafana Cloud OTLP endpoint and authentication details.
Sign in to Grafana Cloud.
Open your Grafana Cloud stack.
Find the OpenTelemetry section and click Configure.
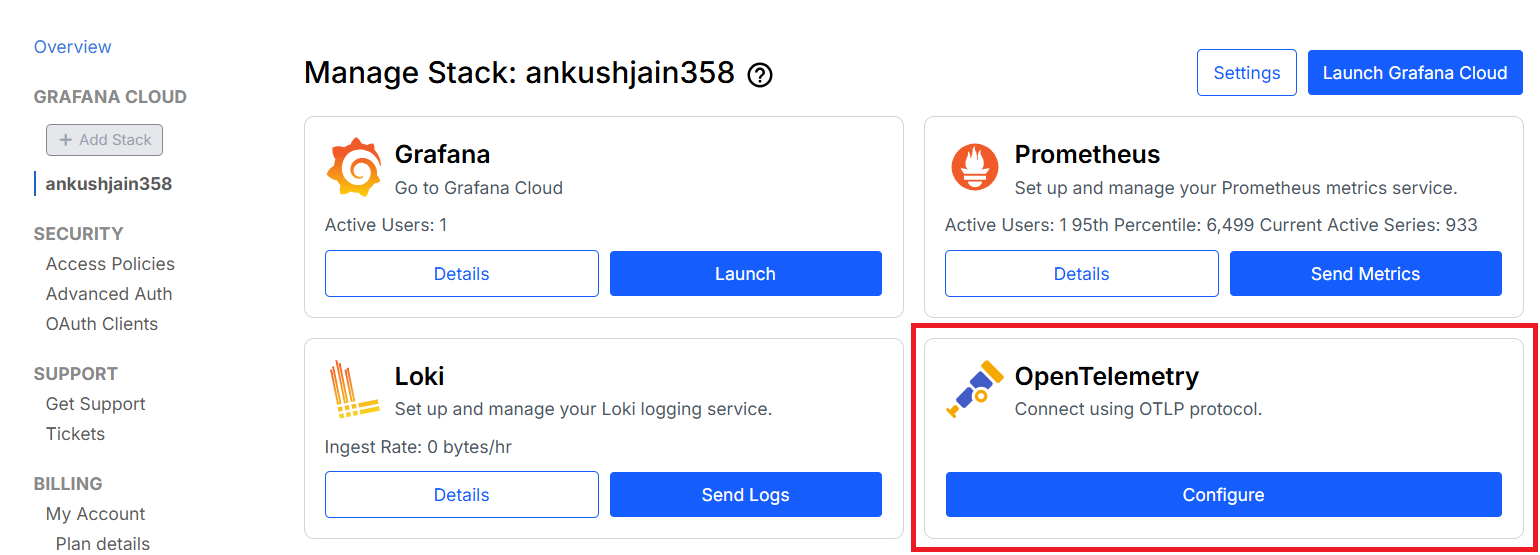
Copy the OTLP Endpoint and Instance ID.
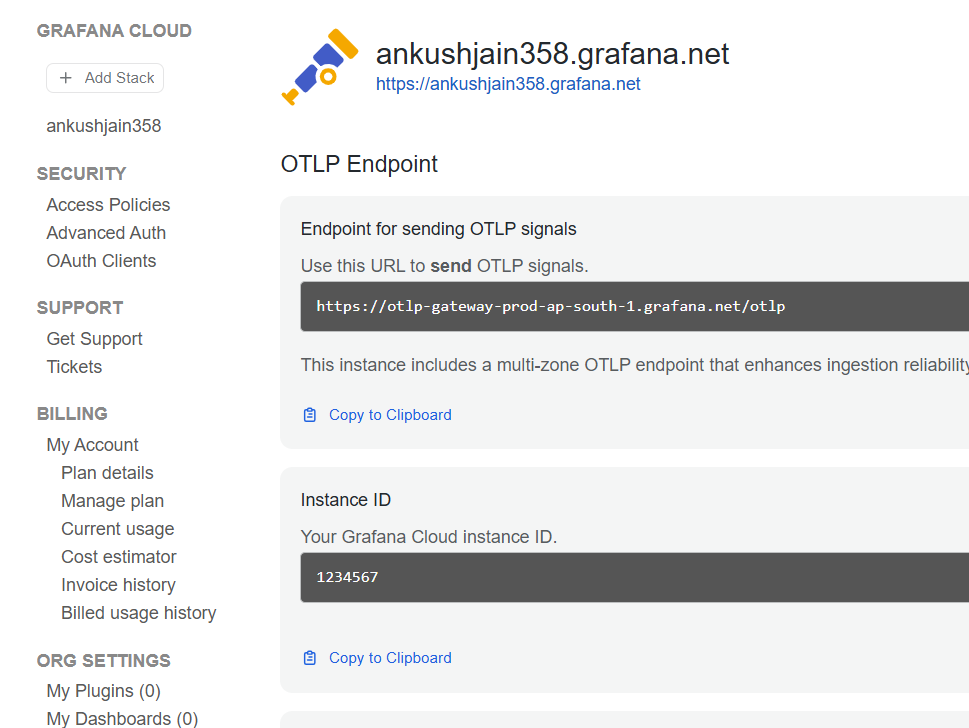
Generate an API token if you don't already have one.
Copy the generated authentication value.
The authentication used by Grafana Cloud is HTTP Basic authentication, where the username is the Grafana Cloud OTLP Instance ID and the password is the API token. Your final authorization header will look similar to:
Authorization: Basic <BASE64_ENCODED_INSTANCE_ID_AND_TOKEN>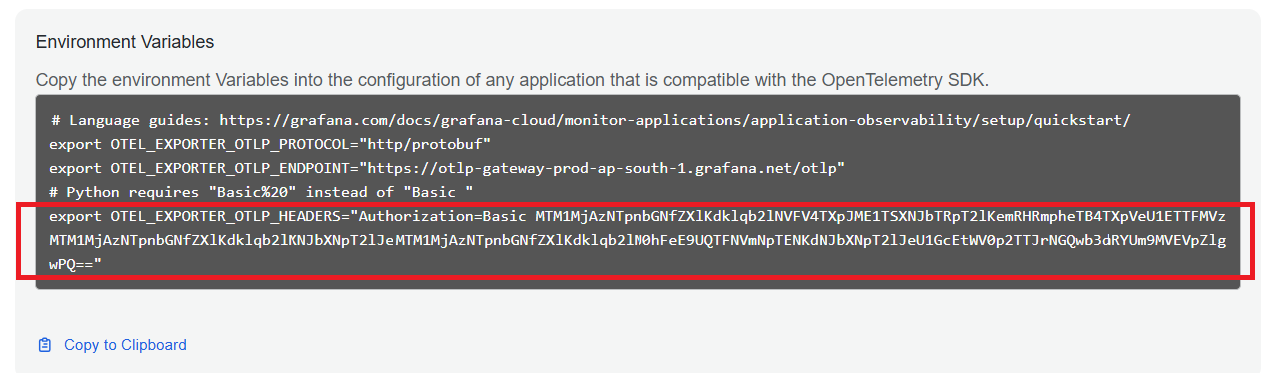 And don't worry, the above token has been malformed, and won't work.
Step 2: Create an OpenTelemetry Collector
Instead of sending telemetry directly from VS Code to Grafana Cloud, we will run a local OpenTelemetry Collector.
This gives us a simple architecture where VS Code only needs to communicate with a local endpoint:
VS Code → localhost:4317 → OpenTelemetry Collector → Grafana Cloud
Create the Collector configuration
Create a file named:
otel-collector-config.yaml
Add the following configuration:
receivers:
  otlp:
    protocols:
      grpc:
        endpoint: 0.0.0.0:4317
      http:
        endpoint: 0.0.0.0:4318

processors:
  batch:

exporters:
  otlphttp/grafana:
    endpoint: https://otlp-gateway-prod-<REGION>.grafana.net/otlp
    headers:
      Authorization: "Basic <GRAFANA_AUTH_HEADER>"

service:
  pipelines:
    traces:
      receivers: [otlp]
      processors: [batch]
      exporters: [otlphttp/grafana]

    metrics:
      receivers: [otlp]
      processors: [batch]
      exporters: [otlphttp/grafana]

    logs:
      receivers: [otlp]
      processors: [batch]
      exporters: [otlphttp/grafana]
Replace:
<REGION>with the region from your Grafana Cloud OTLP endpoint.<GRAFANA_AUTH_HEADER>with theBasic ...value generated from your Grafana Cloud credentials.
The OpenTelemetry Collector supports OTLP over both gRPC and HTTP. Here, VS Code will use OTLP/gRPC on port 4317, while the Collector uses the OTLP/HTTP exporter to send telemetry to Grafana Cloud.
Run the Collector on macOS/Linux
From the directory containing otel-collector-config.yaml, run:
docker run --rm \
  --name otel-collector \
  -p 4317:4317 \
  -p 4318:4318 \
  -v "$(pwd)/otel-collector-config.yaml:/etc/otelcol-contrib/config.yaml" \
  otel/opentelemetry-collector-contrib:latest \
  --config=/etc/otelcol-contrib/config.yaml
The official Collector Docker images support mounting a custom configuration file into the container.
Run the Collector on Windows
If you are using PowerShell:
docker run --rm `
  --name otel-collector `
  -p 4317:4317 `
  -p 4318:4318 `
  -v "${PWD}\otel-collector-config.yaml:/etc/otelcol-contrib/config.yaml" `
  otel/opentelemetry-collector-contrib:latest `
  --config=/etc/otelcol-contrib/config.yaml
After starting the container, the Collector will listen for OTLP telemetry on:
gRPC → localhost:4317
HTTP → localhost:4318
The Collector's standard OTLP receiver supports both ports.
Step 3: Enable OpenTelemetry Monitoring in VS Code
VS Code provides built-in OpenTelemetry monitoring for GitHub Copilot Chat.
According to the current VS Code documentation, Copilot Chat can export traces, metrics, and events using OpenTelemetry.
Open the Command Palette:
- Windows/Linux:
Ctrl + Shift + P - macOS:
Cmd + Shift + P
Search for Preferences: Open User Settings (JSON), and add the following settings:
{
  "github.copilot.chat.otel.enabled": true,
  "github.copilot.chat.otel.dbSpanExporter.enabled": true,
  "github.copilot.chat.otel.captureContent": true,
  "github.copilot.chat.otel.exporterType": "otlp-grpc",
  "github.copilot.chat.otel.otlpEndpoint": "http://localhost:4317"
}
After changing the settings, reload VS Code:
Ctrl + Shift + P → Developer: Reload Window
On macOS, you can also use Cmd + Shift + P to open the Command Palette.
Step 4: Generate Telemetry
Now start using GitHub Copilot normally.
For example:
- Ask Copilot questions.
- Use Agent mode.
- Ask it to generate or modify code.
- Use tools through Copilot.
- Have longer conversations that generate multiple LLM requests.
VS Code will emit OpenTelemetry data, which will follow this path:
GitHub Copilot
      ↓
VS Code OpenTelemetry
      ↓
localhost:4317
      ↓
OpenTelemetry Collector
      ↓
Grafana Cloud OTLP endpoint
The Collector batches the telemetry and forwards it to Grafana Cloud.
Step 5: View the Data in Grafana
Once telemetry starts flowing, open your Grafana Cloud stack and explore the relevant observability data.
You should be able to find the telemetry under the appropriate Grafana data sources.
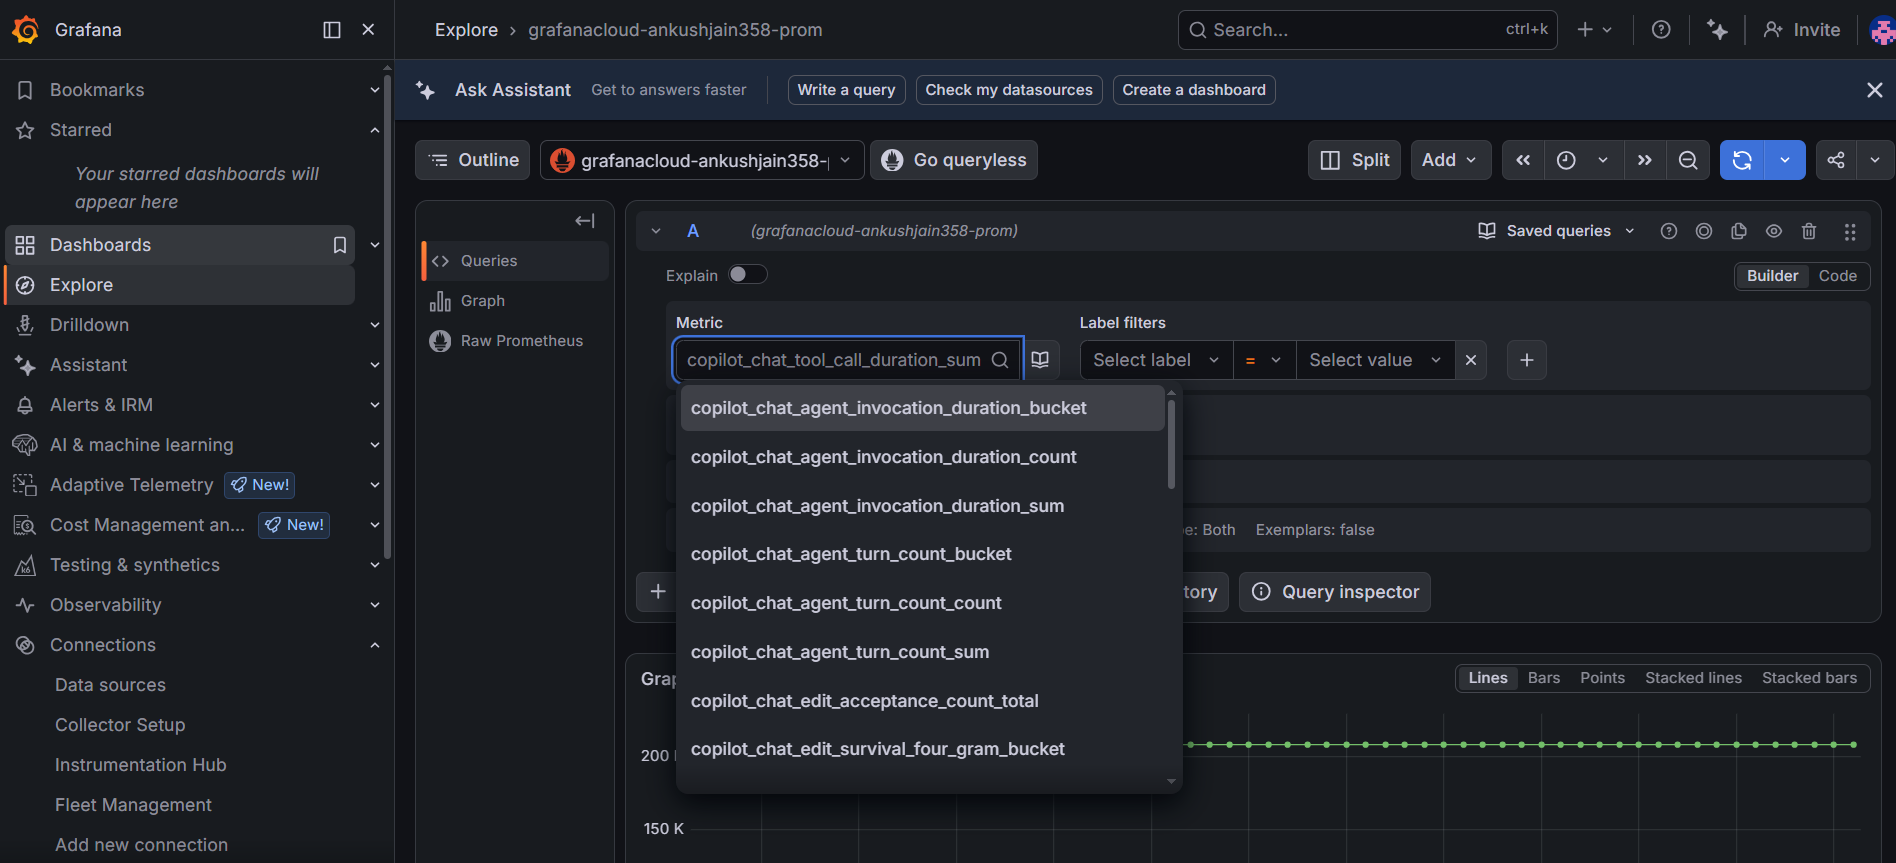
Metrics
Metrics can be used to understand usage patterns and numerical measurements such as token-related information.
For example, you can use Grafana dashboards and queries to analyze:
- Token consumption
- Request counts
- Usage over time
- Input/output token patterns
- Other Copilot-related metrics emitted through OTel
Refer the below picture to see how the metrices appear in the Grafana.
 The graph below shows an example of the total input and output tokens consumed over time.
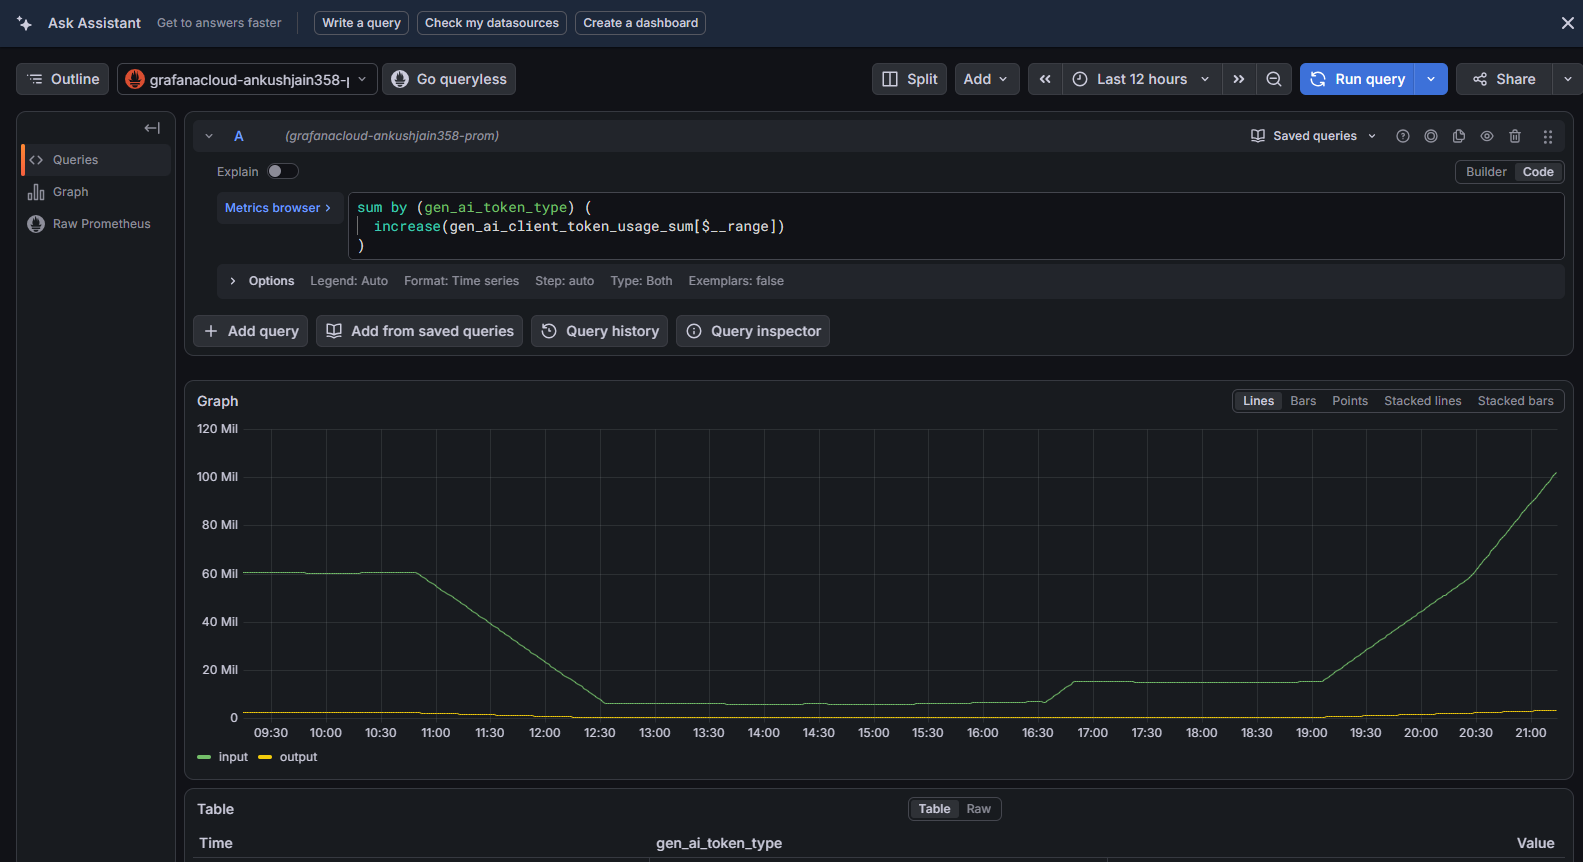 The chart above illustrates the trends over time.
Traces
Traces are useful for understanding individual Copilot interactions and the operations involved in an agent request.
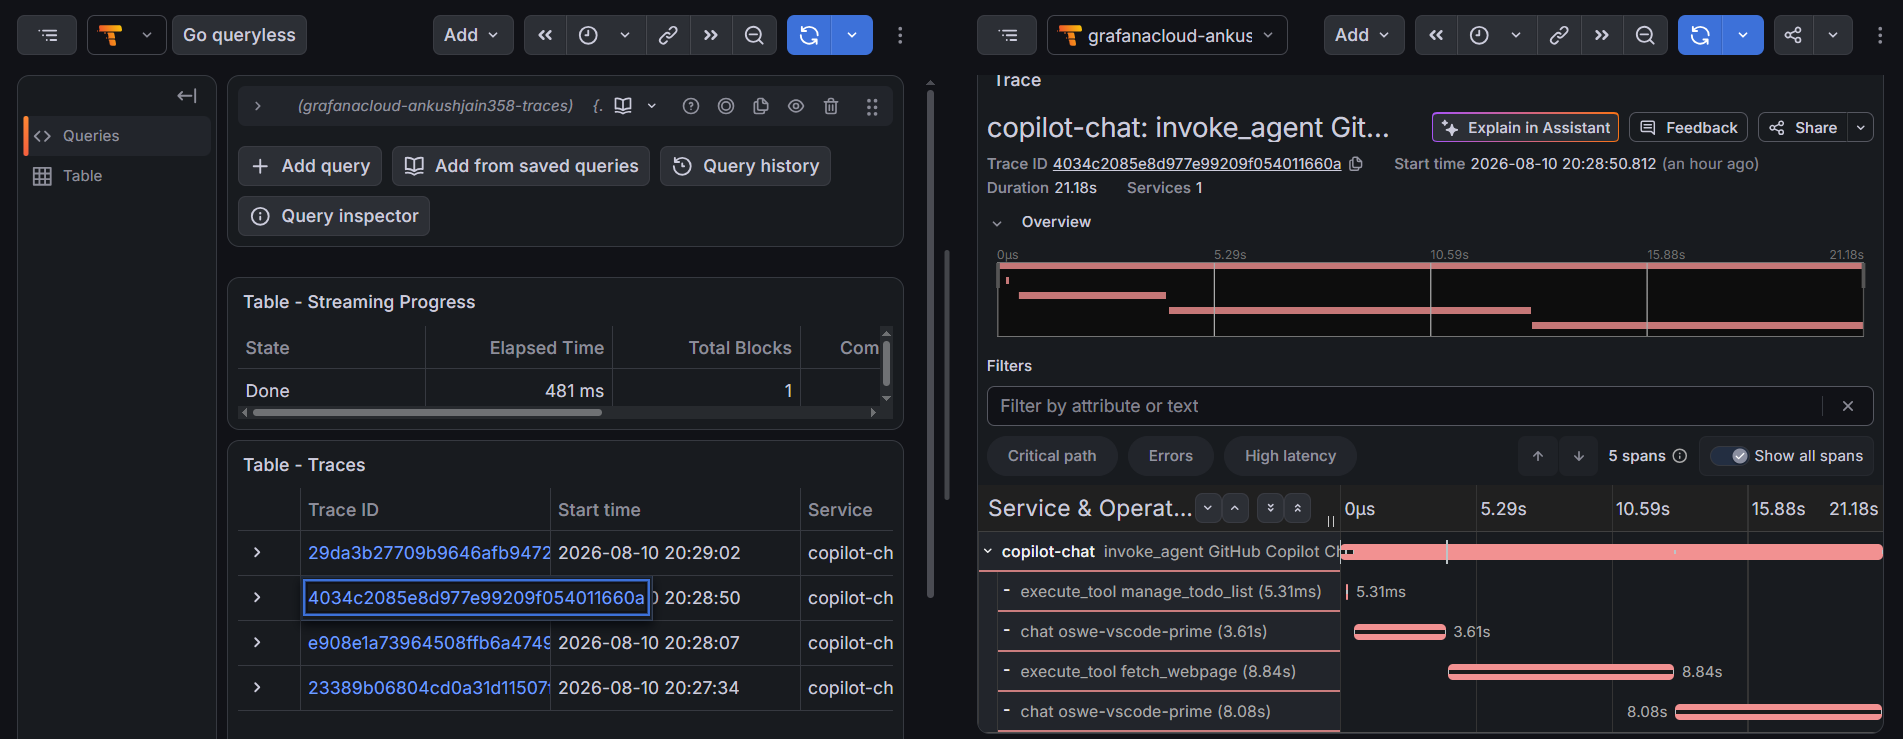 The trace view above details the step-by-step execution path.
Logs / Events
See the logs appearing in Loki.
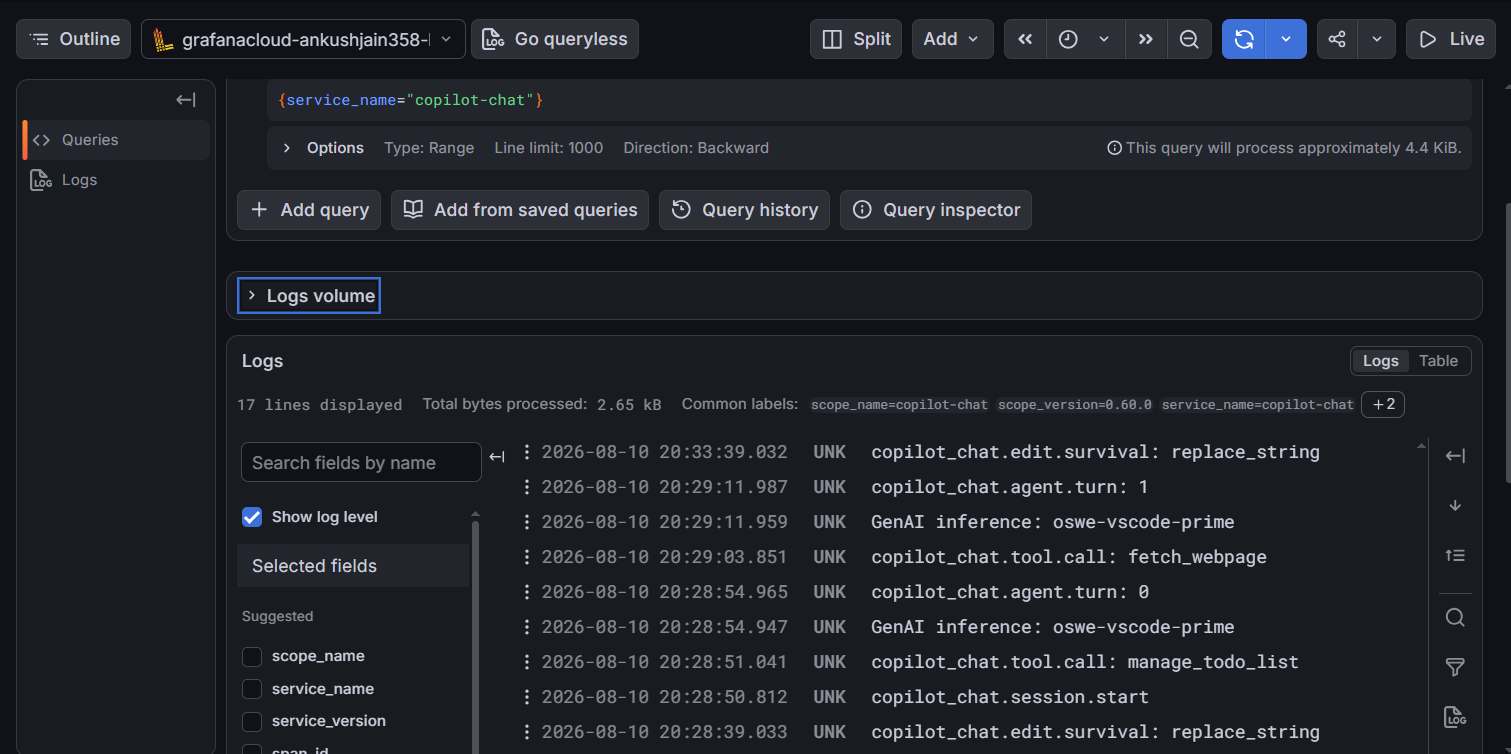 The log list above displays the real-time events.
What Can We Learn From This?
Once the telemetry is available in Grafana, we can start building dashboards to answer questions such as:
- How frequently am I using GitHub Copilot?
- How many tokens are being consumed?
- Which activities consume the most tokens?
- How does token usage change over time?
- What does an individual Copilot interaction look like?
- How long do different Copilot operations take?
This becomes especially useful if you are using Copilot heavily and want to understand your usage rather than simply treating it as a black box.
Conclusion
With a few configuration changes, we can capture GitHub Copilot's OpenTelemetry data from VS Code, route it through a local OpenTelemetry Collector, and send it to Grafana Cloud.
The final setup looks like this:
┌──────────────┐
│   VS Code    │
│ GitHub       │
│ Copilot      │
└──────┬───────┘
       │
       │ OTLP/gRPC
       │ :4317
       ▼
┌──────────────────────┐
│ OpenTelemetry        │
│ Collector            │
└──────────┬───────────┘
           │
           │ OTLP/HTTP
           ▼
┌──────────────────────┐
│     Grafana Cloud    │
│                      │
│ Metrics / Traces /   │
│ Logs & Events        │
└──────────────────────┘
This provides a useful foundation for building Grafana dashboards around GitHub Copilot usage and understanding how AI-assisted development is being used.