Prometheus is one of the most widely used monitoring systems in modern distributed architectures. While it appears simple at first glance, many developers struggle to build a correct mental model of how metrics are stored, queried, and visualized. This guide explains the core concepts in a structured and practical way, so you can confidently reason about Prometheus behavior in real systems.
1. Metrics and Time Series
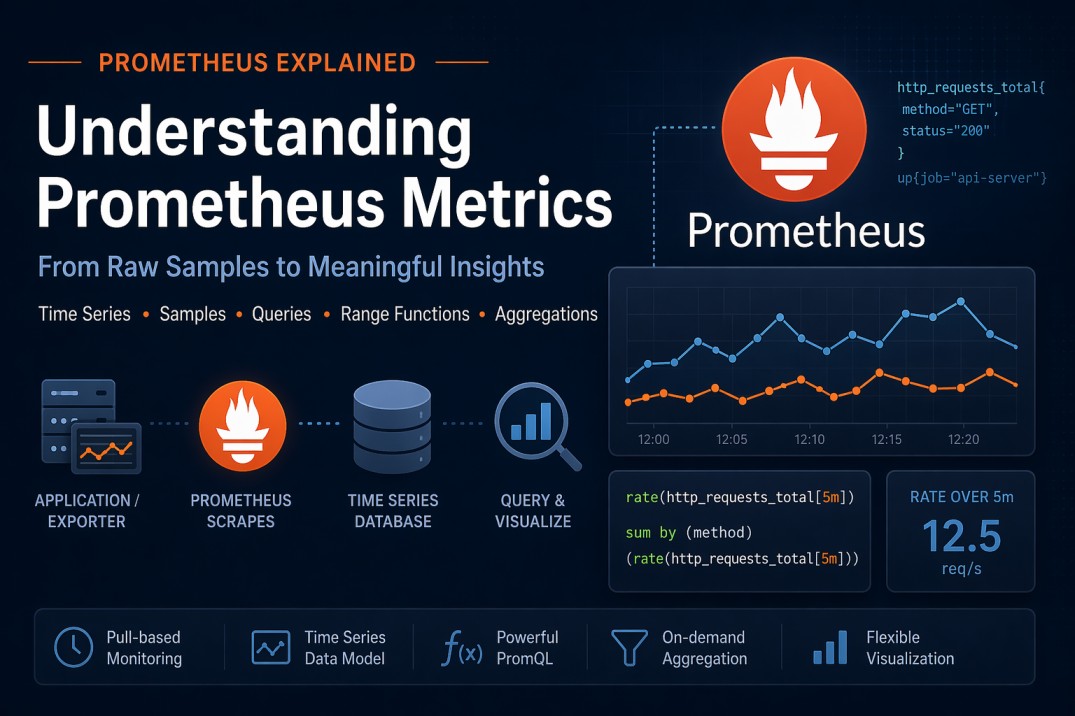
In Prometheus, a metric is not just a single stream of data. Instead, it represents a family of time series, each uniquely identified by a set of labels.
A time series is defined as:
Metric name + complete set of labels
Example
http_requests_total{method="GET", status="200"}
http_requests_total{method="POST", status="500"}
Although both belong to the same metric (http_requests_total), they are different time series because their labels differ.
2. Samples: The Building Blocks of Time Series
Each time series consists of samples, where every sample is:
(timestamp, value)
Over time, Prometheus stores these samples in sequence, forming a timeline of metric values.
3. Scraping: How Data Enters Prometheus
Prometheus uses a pull-based model, meaning it periodically fetches metrics from targets (applications, exporters, etc.).
Key Characteristics
- Prometheus only retrieves the current/latest value at scrape time.
- It does not fetch historical data from the target.
- The scrape interval determines how frequently samples are recorded.
Example
If the scrape interval is 15 seconds, then:
- Prometheus stores one sample every 15 seconds
- Any intermediate changes inside the application are not captured
This is an important distinction from systems that push or batch metrics.
4. Query Evaluation and Graph Resolution
When you query Prometheus (e.g., via Grafana), the result is computed over a time range with a specific step (resolution).
Example
- Time range: 1 hour
- Step: 5 minutes
Prometheus evaluates the query at:
t0, t0 + 5m, t0 + 10m, ..., t0 + 1h
At each step, it computes a value based on the query expression.
5. Instant Queries vs Range Queries
Instant queries return only the most recent sample at a given point in time, whereas range queries return all samples within the specified time window.
Prometheus queries operate in two fundamental ways:
Instant Queries (No Range Function)
When you query a metric directly:
http_requests_total
At each evaluation step:
- Prometheus selects the most recent sample before that timestamp
- It uses a lookback window (default: 5 minutes)
- If no recent sample exists → the series is considered stale
To understand how instant queries behave, consider the following endpoint:
http://localhost:9090/api/v1/query?query=prometheus_http_requests_total{handler=~"/api/v1/query_range"}
This query returns a single sample per time series. Specifically, it retrieves the most recent value available at the evaluation timestamp (subject to Prometheus’s lookback window).
{
  "status": "success",
  "data": {
    "resultType": "vector",
    "result": [
      {
        "metric": {
          "__name__": "prometheus_http_requests_total",
          "code": "200",
          "handler": "/api/v1/query_range",
          "instance": "localhost:9090",
          "job": "prometheus"
        },
        "value": [1776973645.528, "97"
        ]
      }
    ]
  }
}
In other words, even if multiple samples exist over time, an instant query only returns one latest data point for each matching time series.
Range Queries (Using Range Vectors)
Range queries explicitly request multiple samples over a time window:
http_requests_total[5m]
This retrieves all samples in the last 5 minutes for each step.
Now consider the same metric with a range selector:
http://localhost:9090/api/v1/query?query=prometheus_http_requests_total{handler=~"/api/v1/query_range"}[5m]
This query returns all samples within the last 5-minute window for each matching time series.
{
  "status": "success",
  "data": {
    "resultType": "matrix",
    "result": [
      {
        "metric": {
          "__name__": "prometheus_http_requests_total",
          "code": "200",
          "handler": "/api/v1/query_range",
          "instance": "localhost:9090",
          "job": "prometheus"
        },
        "values": [
          [1776973633.86, "97"
          ],
          [1776973648.856, "97"
          ],
          [1776973663.856, "97"
          ],
          [1776973678.858, "97"
          ],
          [1776973693.854, "97"
          ],
          [1776973708.854, "97"
          ],
          [1776973723.852, "97"
          ],
          [1776973738.853, "97"
          ]
        ]
      }
    ]
  }
}
Unlike instant queries, range queries provide access to multiple data points, which allows Prometheus to apply range functions such as rate(), increase(), or avg_over_time().
6. Range Functions: Turning Raw Data into Insights
Range functions are essential for deriving meaningful insights from raw samples. They operate on all samples within a time window.
Common Range Functions
rate()– per-second rate of change (for counters)increase()– total increase over a periodavg_over_time()– average valuesum_over_time()– sum of valuesmax_over_time()/min_over_time()
7. How rate() Works (Step-by-Step Example)
Consider a counter metric:
http_requests_total
Suppose the samples over 5 minutes are:
| Time | Value |
|---|---|
| 00:00:00 | 100 |
| 00:01:00 | 130 |
| 00:02:00 | 160 |
| 00:03:00 | 190 |
| 00:04:00 | 220 |
Query
rate(http_requests_total[5m])
What Prometheus Does
At each evaluation step:
- Collects all samples in the last 5 minutes
- Calculates the slope (rate of increase per second)
Calculation
Total increase = 220 - 100 = 120
Time duration = 5 minutes = 300 seconds
Rate = 120 / 300 = 0.4 requests/sec
Important Notes
rate()uses all samples in the window, not just first and last- It handles counter resets automatically
- Output is always a per-second rate
8. Behavior Based on Metric Types
Prometheus does not strictly enforce metric types, but understanding their intended use is crucial for correct queries.
Counter
- Monotonically increasing (except resets)
- Examples: request count, error count
Recommended functions:
rate()increase()
Why: These functions calculate change over time.
Gauge
- Represents current value
- Can increase or decrease
- Examples: CPU usage, memory usage
Recommended functions:
avg_over_time()max_over_time()min_over_time()
Why: Gauges represent instantaneous values, so statistical summaries are useful.
Histogram
- Represents distribution of values
- Stored as multiple time series (
_bucket,_sum,_count)
Common usage:
histogram_quantile(0.95, rate(request_duration_seconds_bucket[5m]))
Why: Enables percentile calculations like p95 latency.
9. Aggregation in Prometheus is Explicit
Prometheus does not automatically aggregate data across samples or time series.
Aggregation must be explicitly defined in queries.
Example
sum(rate(http_requests_total[5m]))
This performs two operations:
rate()→ calculates per-series ratesum()→ aggregates across all matching time series
With grouping
sum by (method) (rate(http_requests_total[5m]))
This groups results by the method label.
10. Understanding Samples vs Aggregation Windows
A common misconception is that Prometheus automatically groups samples within a time interval (e.g., 1 minute) and aggregates them.
This is not how it works.
Without Range Functions
http_requests_total
- Only one value per step is used
- That value is the latest sample before the timestamp
With Range Functions
sum_over_time(metric[1m])
Prometheus explicitly:
- Collects all samples in the last 1 minute
- Applies the function (
sum,avg, etc.)
👉 Only range functions operate on multiple samples.
11. Prometheus vs CloudWatch: Key Differences
Understanding this comparison helps clarify Prometheus design decisions.
CloudWatch
Stores pre-aggregated datapoints
Each datapoint includes:
SumMinMaxSampleCount
This allows flexible post-processing but increases storage complexity.
Prometheus
- Stores raw samples only
- No built-in aggregation at ingestion time
All computations (rate, average, percentiles) happen at:
Query time
12. Final Mental Model
To summarize:
Scraping
- Prometheus pulls the latest value at fixed intervals
Storage
- Data is stored as raw samples
(timestamp, value)
- Data is stored as raw samples
Query Execution
- Instant query → latest sample
- Range query → all samples in a window
Computation
- Range functions → operate on samples
- Aggregations → combine time series
Conclusion
Prometheus is designed around a simple but powerful idea:
Store raw time-series data and compute everything at query time.
Once you understand how samples, time series, and range functions interact, writing correct and efficient PromQL queries becomes much easier. This mental model is especially valuable when designing observability systems, debugging production issues, or preparing for system design interviews.